The Servers management area of the CMC displays server metrics that provide statistics and information about each BusinessObjects Enterprise server. The general information displayed for each server includes information about the machine that the server is running on—its name, operating system, total hard disk space, free hard disk space, total RAM, number of CPUs, and local time. The general information also includes the time the server started and the version number of the server.
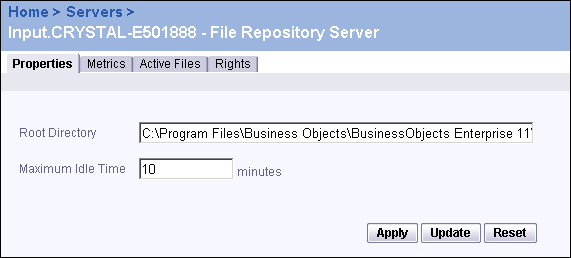
This example shows the metrics for an Input File Repository Server that is running on a machine called Crystal.
The Metrics tabs for the following servers include additional, server
The Metrics tab of each File Repository Server lists the root directory of the files that the server maintains, indicates the maximum idle time, and displays the number of active files and active client connections. It also lists the total available hard disk space, as well as the number of bytes sent and received.
Each File Repository Server also has an Active Files tab, which lists the filename, the number of readers, and the number of writers for each active file.
The Metrics tab of the Cache Server displays the maximum number of processing threads, the maximum cache size, the minutes before an idle job is closed, the minutes between refreshes from the database, whether or not the database is accessed whenever a viewer's file (object) is refreshed, the location of the cache files, the total threads running, the number of requests served, the number of bytes transferred, the cache hit rate, the number of current connections, and the number of requests that are queued.
The Metrics tab also provides a table that lists the Page Servers that the Cache server has connections to, along with the number of connections made to each Page Server.
The Metrics tab of the Event Server contains statistics on the files that the server is monitoring. This tab includes a table showing the file name and the last time the event occurred.
The Metrics tab of the Page Server contains information on how the server is running. It lists the maximum number of simultaneous report jobs, the location of temporary files, the number of minutes before an idle connection is closed, the minutes before a report job is closed, the maximum number of database records shown when previewing or refreshing a report, the oldest processed data given to a client, whether a viewer refresh always hits the database, and the setting for the Report Job Database Connection. It also shows the number of current connections, the number of requests queued, the current number of processing threads running, the total number of requests served, and the total bytes transferred.
The Metrics tab of the Report Application Server (RAS) shows the number of reports that are open, and the number of reports that have been opened. It also shows the number of open connections, along with the number of open connections that have been created.
The Metrics tabs of these servers list the current number of jobs that are being processed, the total number of requests received, the total number of failed job creations, the processing mode, and the location of its temporary files.
The Metrics tab of the CMS lists only the general information about the machine it is running on. The Properties tab, however, shows a list of users who have active sessions on the system. Click any user's link to view the associated account details.
The Metrics tab of the Connection Server shows the current settings, including HTTP and CORBA protocol settings, trace settings, connection pooling, and the timeout duration for inactive jobs. You can change these settings on the Properties tab. The Metrics tab also lists general information about the machine it is running on.
These servers, which process information only for Desktop Intelligence documents, provide the same metrics as standard cache and job servers.
|
|
|
|
| Business Objects http://www.businessobjects.com/ Support services http://www.businessobjects.com/services/support/ Product Documentation on the Web http://support.businessobjects.com/documentation/ |